Step #1
Start by opening the 2H timeframe and identify the overall market direction. Focus on the wave structure and look for a clear trend continuation rather than a reversal.
Next, confirm alignment:
- The Pulse (red) should point in the same direction as the trend
- The Micro (yellow) should be reaching a local top or bottom, signaling momentum alignment
Once all components are in sync you have a high-probability directional bias. At this point, switch down to the 15m timeframe to fine-tune your entry and catch the move with better precision.
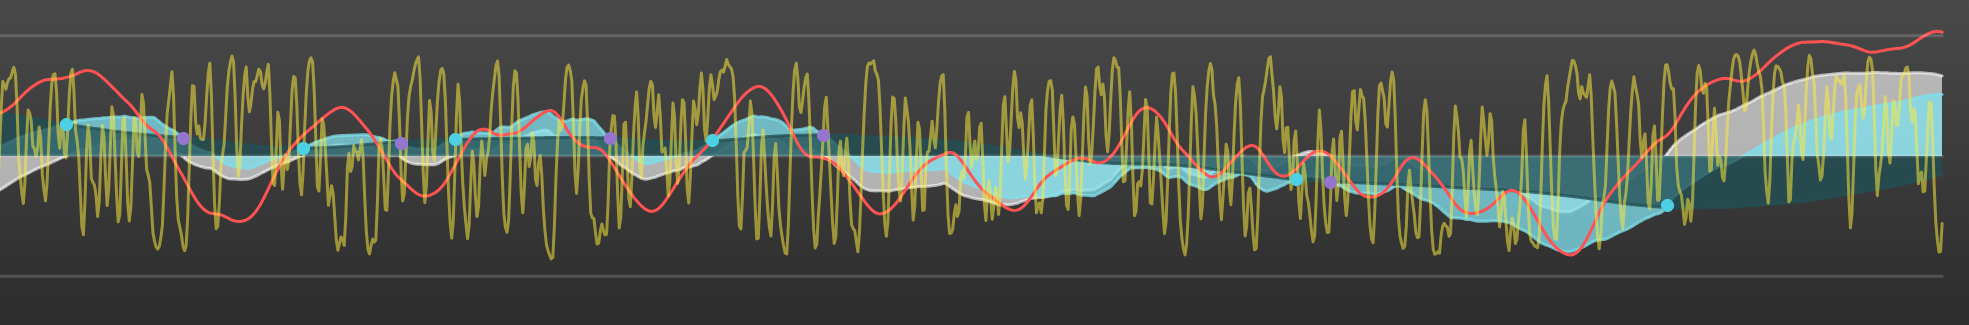
In this example it’s a strong uptrend as the waves keep growing upwards and the Macro has been staying up for a long time. However, there are some obvious pullbacks as the Micro is bottoming. We’ll take a closer look on the 15m timeframe.
Step #2
Switch to the 15m timeframe.
Here, you’ll notice the 2H Micro (yellow) appears as the Pulse on this timeframe. This will be your main guide throughout the trade — but don’t rush into an entry yet.
Instead, stay patient and wait for proper structure to form:
- The waves should reach a clear top or bottom formation in line with your higher timeframe bias
- The 15m Pulse (gray) should also align, topping or bottoming in the same direction
Once you spot this setup you’re ready to move down to the 1m timeframe for entry execution.
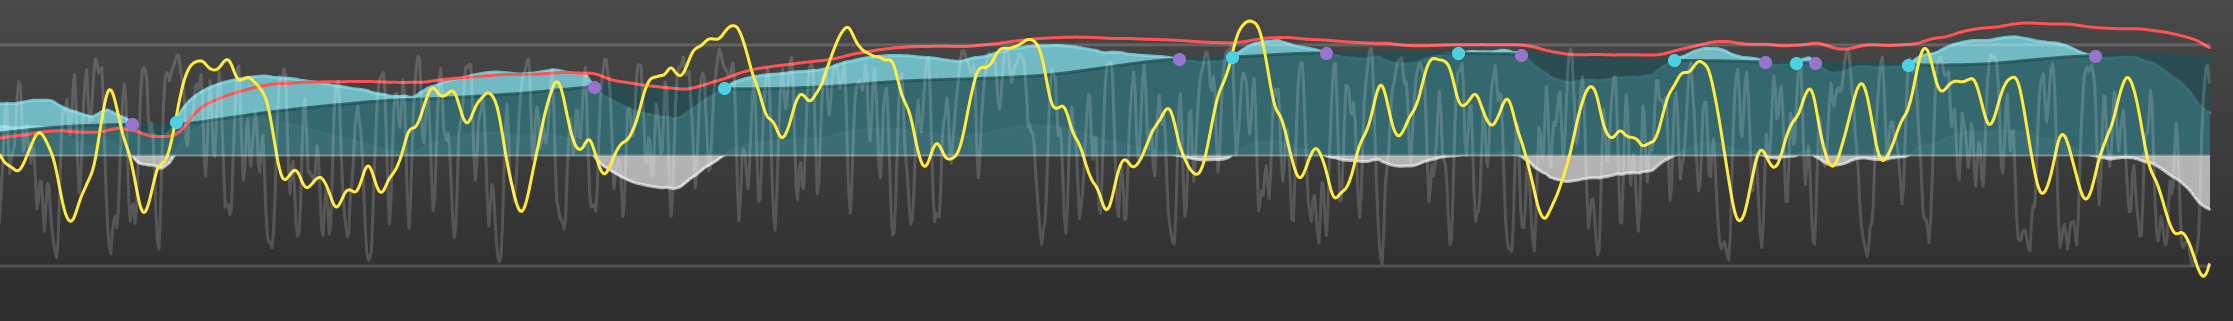
The example shows a pullback on the 15m timeframe, as expected. The light waves are pointing down and the Pulse has moved well below the zero line. On the 2H it was a clear, strong uptrend also the dark green wave is staying up confidently on the 15m while the Pulse is bottoming. We can start looking for an entry on the 1m timeframe.
Step #3
Switch to the 1m timeframe.
At this level:
- The 2H Micro (yellow) appears as your Macro
- The 15m Micro becomes your Pulse (white)
These will guide your execution. Again, patience is key — don’t enter immediately. Wait for the market to form a clear top or bottom structure on the waves. At the same time, it’s crucial if the Pulse (white) is also topping or bottoming in alignment with your intended direction.
The entry comes on Pulse turn — once the structure is formed and price starts to move away from that top or bottom you can step into the trade. From here, your goal is to ride the Macro (yellow) for as long as possible paying close attention to the behavior and structure of the waves.
For even finer control you can drop to the 15s timeframe to track micro-movements and manage your position more precisely.
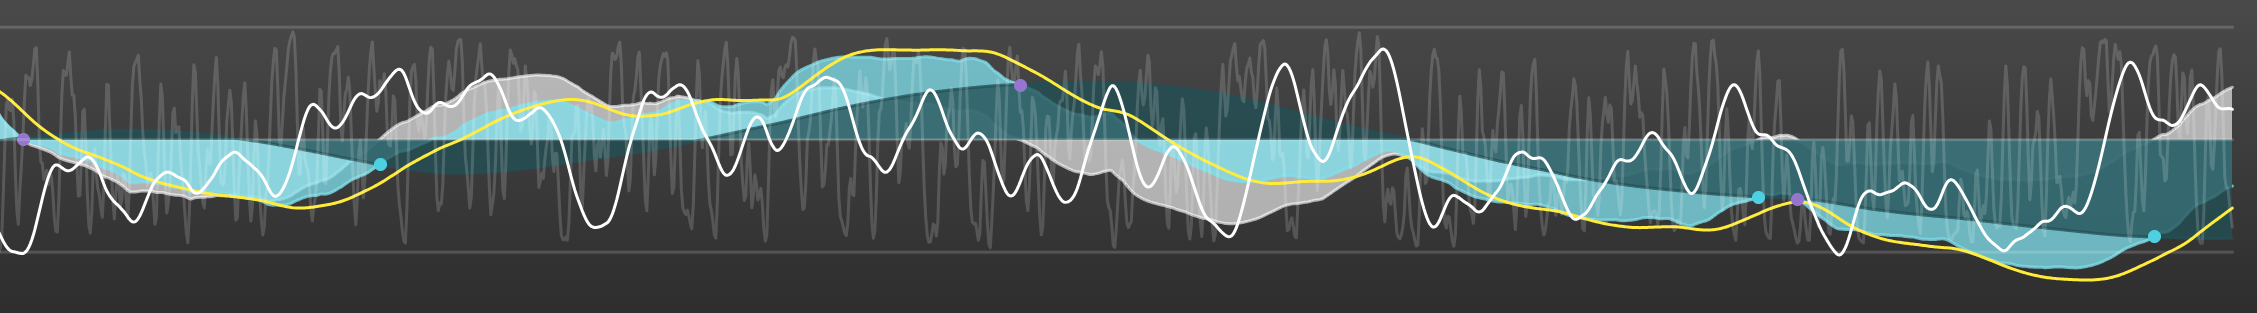
In our example, it is clearly forming a bottom on the 1m timeframe as the waves are starting to change direction upwards after staying below the zero line for a long time. The Macro is also pointing up. We can enter the trade once the Pulse starts bottoming below the middle line.
Alerts
Alerts can be set for the turn of Micro below/above the zero line on 2H, Micro of the 15m, Pulse of the 1m and Pulse of 15S. However, the key trigger for entries is the Pulse turning on the 1 minute chart. Set alerts for both long and short signals then go about your day. When an alert is triggered, check the chart to confirm whether it’s a valid entry. With enough experience it’ll take no more than a few seconds.
Balance Management
The Axiom Indicator uses a completely unique approach to balance management.
Instead of relying on traditional take-profit (TP) and stop-loss (SL) levels like most traders, decisions are made by following the behavior of the waves. These wave structures determine whether a position should be held or closed. If the trade remains open the duration is guided by the wave progression.
Because of this approach it’s essential to choose a leverage level (or lot size) that can comfortably withstand temporary counter-movements. The exact tolerance will vary depending on the asset so this needs to be refined through experience and observation.
The core idea behind this balance management model is to compound a relatively small starting capital through consecutive trades until it grows approximately 10-30x. At that point, the majority of the capital is withdrawn and a new trading session begins using only 10% of the accumulated profit.
This method allows for rapid capital growth while maintaining a high level of security since most of the profits are consistently taken out at the end of each cycle.
This site and the product are for educational purposes only and should not be construed as financial advice. You must be aware of the risks and be willing to bear any level of risk to invest in financial markets. Creator of Axiom Indicator and all individuals associated assume no responsibility for your trading results or investments.
All rights reserved © 2026